Solving CloudFront Mysteries with AWS Athena
September 28, 2021 - How To・Systems & Infrastructure

PREFACE: This blog post is about AWS infrastructure in general, and not necessarily useful to the average Foxy user. But we think it’s interesting, so we’re sharing it in the hope others might think so too 🙂
Like many stories in cloud infrastructure, this story starts in a very different place than it ends. It started simply enough: How much bandwidth is our API pushing? We use AWS CloudFront for all Foxy endpoints, and our API distribution has different WAF needs than front-end endpoints, so it gets its own distribution.
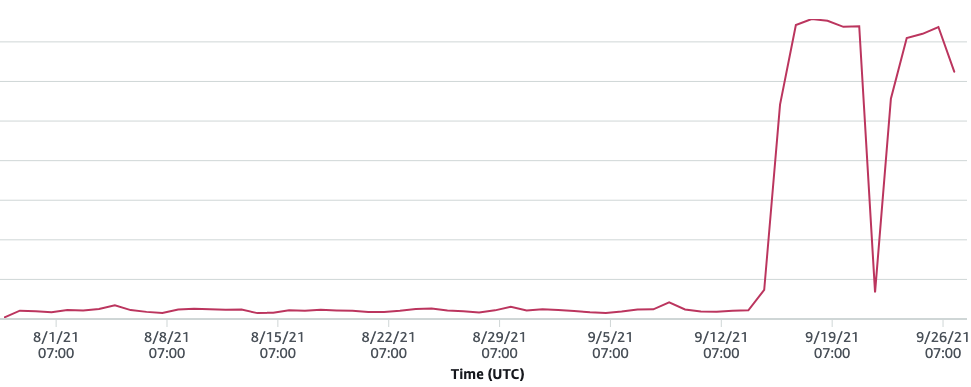
All we need to do is head over to the Reports & analytics -> Usage section in the AWS dashboard, then filter by the distribution we care about, and…
Big Chonky Bandwidth Spikes!

That’s quite a spike!
That is QUITE the spike. Some quick math suggested that if this kept up, it’d cost us at least a few hundred dollars a month. (This particular distribution wasn’t included in our main dashboards, partly because we have hundreds of CloudFront distros, which is too many for AWS to aggregate for us.)
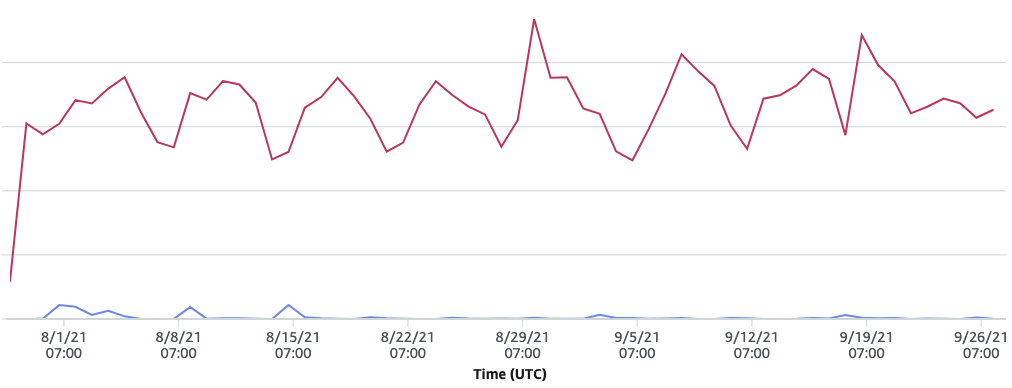
So the immediate question was, effectively, “What the heck?!” It didn’t correspond with an increase in the number of requests, so whatever was doing this wasn’t triggering our WAF (meaning it was likely “valid” API requests):

Thankfully, we have CloudFront logging enabled on all our distributions. This pushes all logs to S3, as gzipped files. Which… are not very helpful. But… BUT…
Searching Gzipped Log Files with SQL a la AWS Athena
Lucky for us all, AWS Athena (and a little bit of Lambda to automate partitioning the files so Athena can filter by date) lets us search our gzipped logs via SQL! We’ve used Athena for a while, but it still seems pretty magical. (And we don’t even need to feel conflicted about AWS commercializing an open source project.)
That said, we typically use Athena for looking for specific requests or IPs. We do some aggregation to keep an eye on which of our users make the most requests, but we never needed to try to figure out massive bandwidth spikes.
Not a problem, though. CloudFront logs output a bytes value, which is the response size (from our API in this case). A quick query…
SELECT count(request_id) as "requests"
    , date
    , sum(bytes) / 1000000000 as "bandwidth"
    , uri
FROM "cf_access_logs_db"."combined"
WHERE host_header = 'api.foxycart.com'
    and date = CAST('2021-09-25' AS DATE)
group by date, uri
order by "bandwidth" desc, uri asc
limit 1000
And…
requests
date
bandwidth
uri
31925
2021-09-25
140
/stores/[REDACTED]/transactions
And there we had it. One single user (whose name you’d recognize) was generating 140GB of traffic, all by themselves.
New Tricks for Old Dogs
None of this is particularly impressive, but we’ve been working on Foxy for 15 years at this point, and sometimes it feels truly incredible to be able to solve problems like this. I’d say “to solve problems like this in minutes instead of hours,” but honestly, back prior to “the cloud”, some of these questions might never have been answered.
Also, as it relates to Foxy: If we roll out bandwidth-based rate limiting in the coming months…
